My prop account positions as of Aug 23, 2024
Following is a listing of trading positions held by my prop account as of Friday's close.
Trades open at end of week on August 23 2024
I am a swing trader in futures and related markets. The basis for all of my trades is classical chart patterns as originally standardized by Richard W Schabacker in his book, Technical Analysis and Stock Market Profits, 1934.Following are the trades open in the Factor Prop account as of Friday, August 23 as presented by the current charts.
Members of the Factor Service are updated during the week via a private X stream.
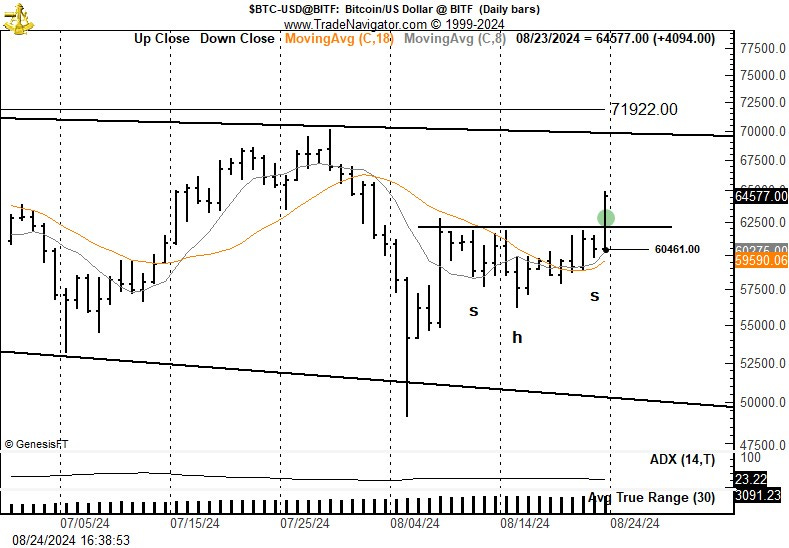
Bitcoin spot
The dominant chart construction on the weekly graph is a 5-month broadening triangle, or megaphone. A major breakout could be pending. The daily chart exhibits a possible completed inverted H&S that is part of the broader congestion. I bought a 2.7 BTC position with a risk of 40 basis points and a protective stop under Friday's low. This is an anticipatory position of a pending larger breakout.
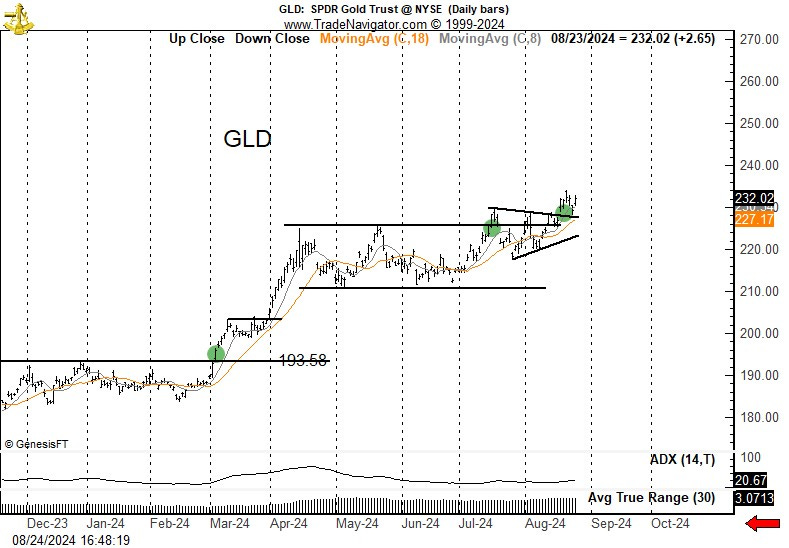
GLD-etf
Factor is long 1,720 shares with split entry dates of Mar 4, 2014 and Aug 17, 2024. The original purchase based based on the completion of a massive inverted H&S pattern. The later purchase was based on the breakout of a rectangle on the daily graph.
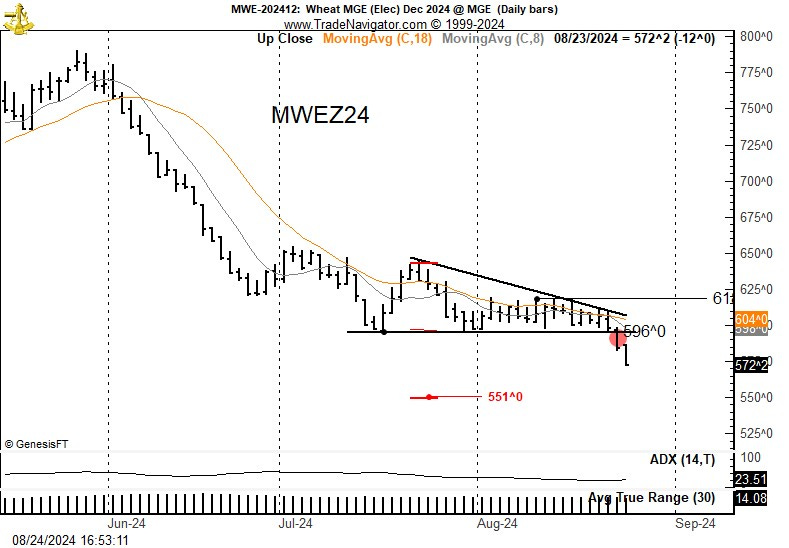
Minneapolis Wheat futures
I shorted 60,000 bushels of Hard Spring Wheat for December delivery this past week based on the completion of a descending triangle. Note the target. Initial risk was 40 basis points. This has been a prolonged bear trend so I will run quick at the target or on any signs of a reversal.
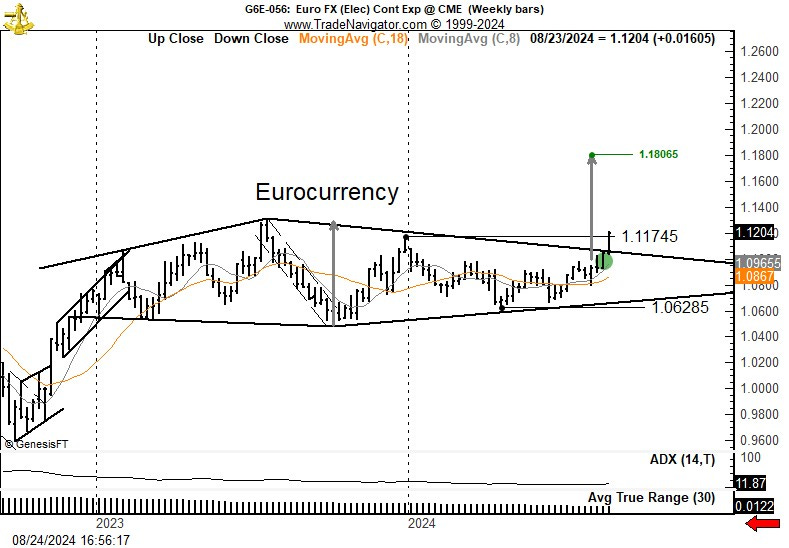
Eurocurrency futures
Factor is long 9 contracts of the mini Dec futures contract (each representing 62,500 EUR) with an initial risk of 43 basis points). A massive diamond has been completed on the weekly chart and this was the basis for the trade.
Canadian Dollar futures
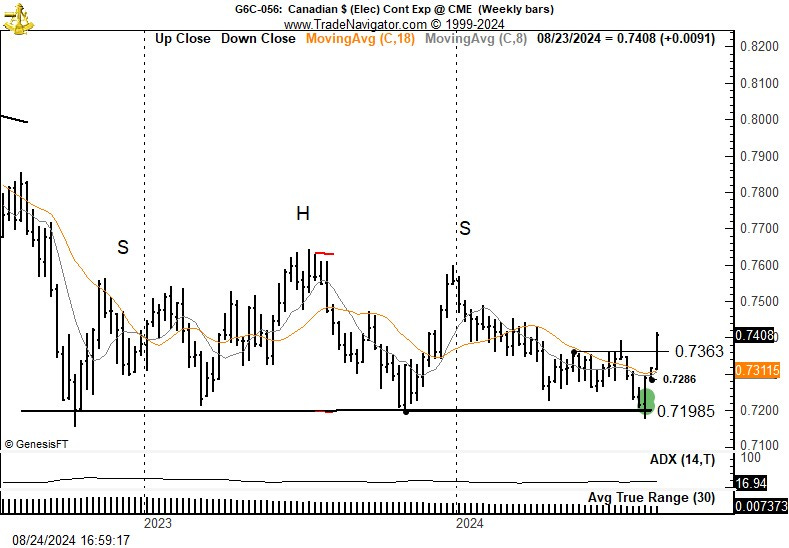
Factor is long 9 contracts of Sep futures, having taken profits this past week on 9 contracts at the initial target. I have an interest in regaining this added leverage on minor corrections. Targets are much higher. The long position was taken on Aug 6 when it was apparent that the sharp decline (and reversal) on Aug 5 was a huge bear trap. The pattern I am playing is a possible H&S failure pattern.
2-Yr T-Note futures
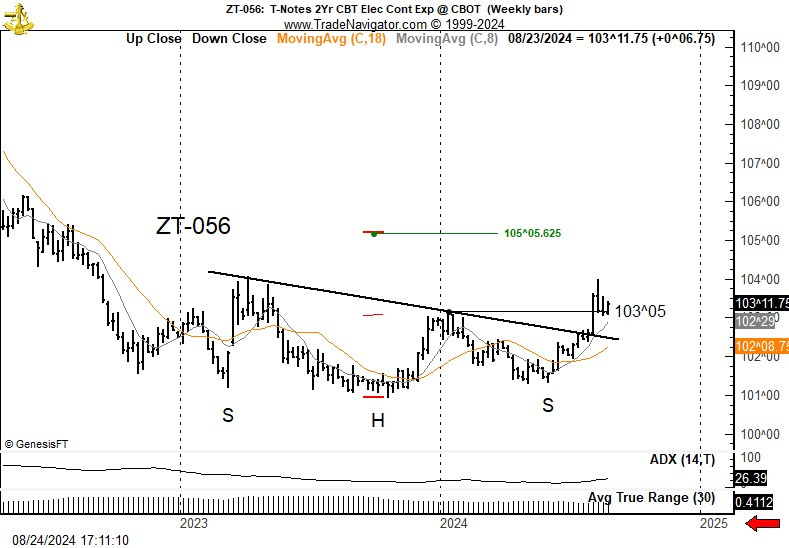
A massive possible inverted H&S has been completed on the continuation chart of the 2-Yr T Note futures. I bought 24 contracts of the Dec futures with an initial risk of 25 basis points on Aug 19 based on a retest of the right shoulder high. The daily chart (not shown) is forming a flag or pennant pattern.
This blog post is provided as an example of how I have analyzed and traded futures markets for 50 years.
End


